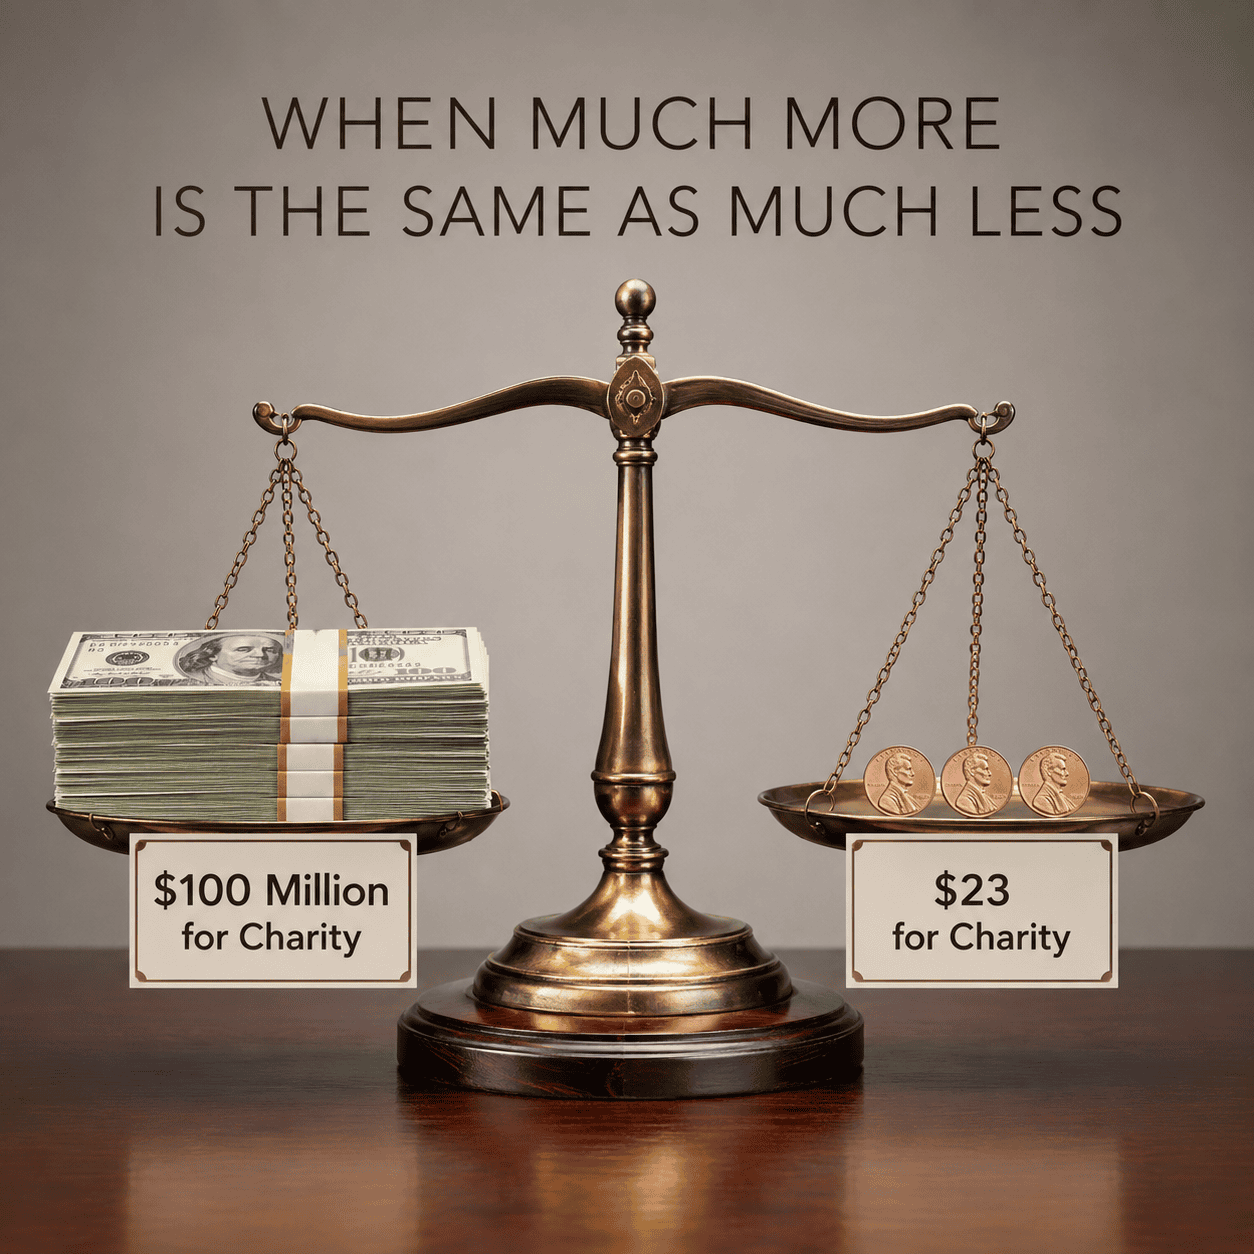
Why a $100 Million Donation and a $23 Donation Are the Same
America’s most thoughtful voices, spanning centuries and deep ideological divides, have warned that concentrated wealth corrodes democratic self-governance, including Benjamin Franklin (1776), President Theodore Roosevelt (1910), Albert Einstein (1949), Senator Barry Goldwater (1960), Federal Reserve Chair Paul Volcker (2018), and Senator Mitt Romney (2026).
The following graphs make it viscerally obvious that America’s wealth inequality spans many orders of magnitude.
Each graph plots the average net worth of a family in each wealth tier, normalized by the average net worth of a family in the bottom 50% tier. In this framework, the average net worth of a family in the bottom 50% is assigned a value of $1, and all other tiers are expressed as a multiple of that $1 value.
The primary data is synthesized from Federal Reserve microdata, IRS capitalization registries, and historical estate estimates (see legend in the Log-Linear graph). To maintain analytical integrity, empirical data points are reported precisely, while modeled ultra-elite micro-percentiles (the top 0.01% down to the top 0.000001%) are rounded to two significant digits, so as to distinguish modeled values from measured ones.
The Obfuscation of a Linear Graph
When plotted on a standard linear scale, the wealth of the top 0.0001%, the billionaire class, is so much larger than that of the bottom 99.9999% that the graph compresses the lower 99.9999% of the population into a flat line that is indistinguishable from the X-axis. Based on this graph alone, it is impossible to assess the relative financial reality for all strata of America’s economic hierarchy.
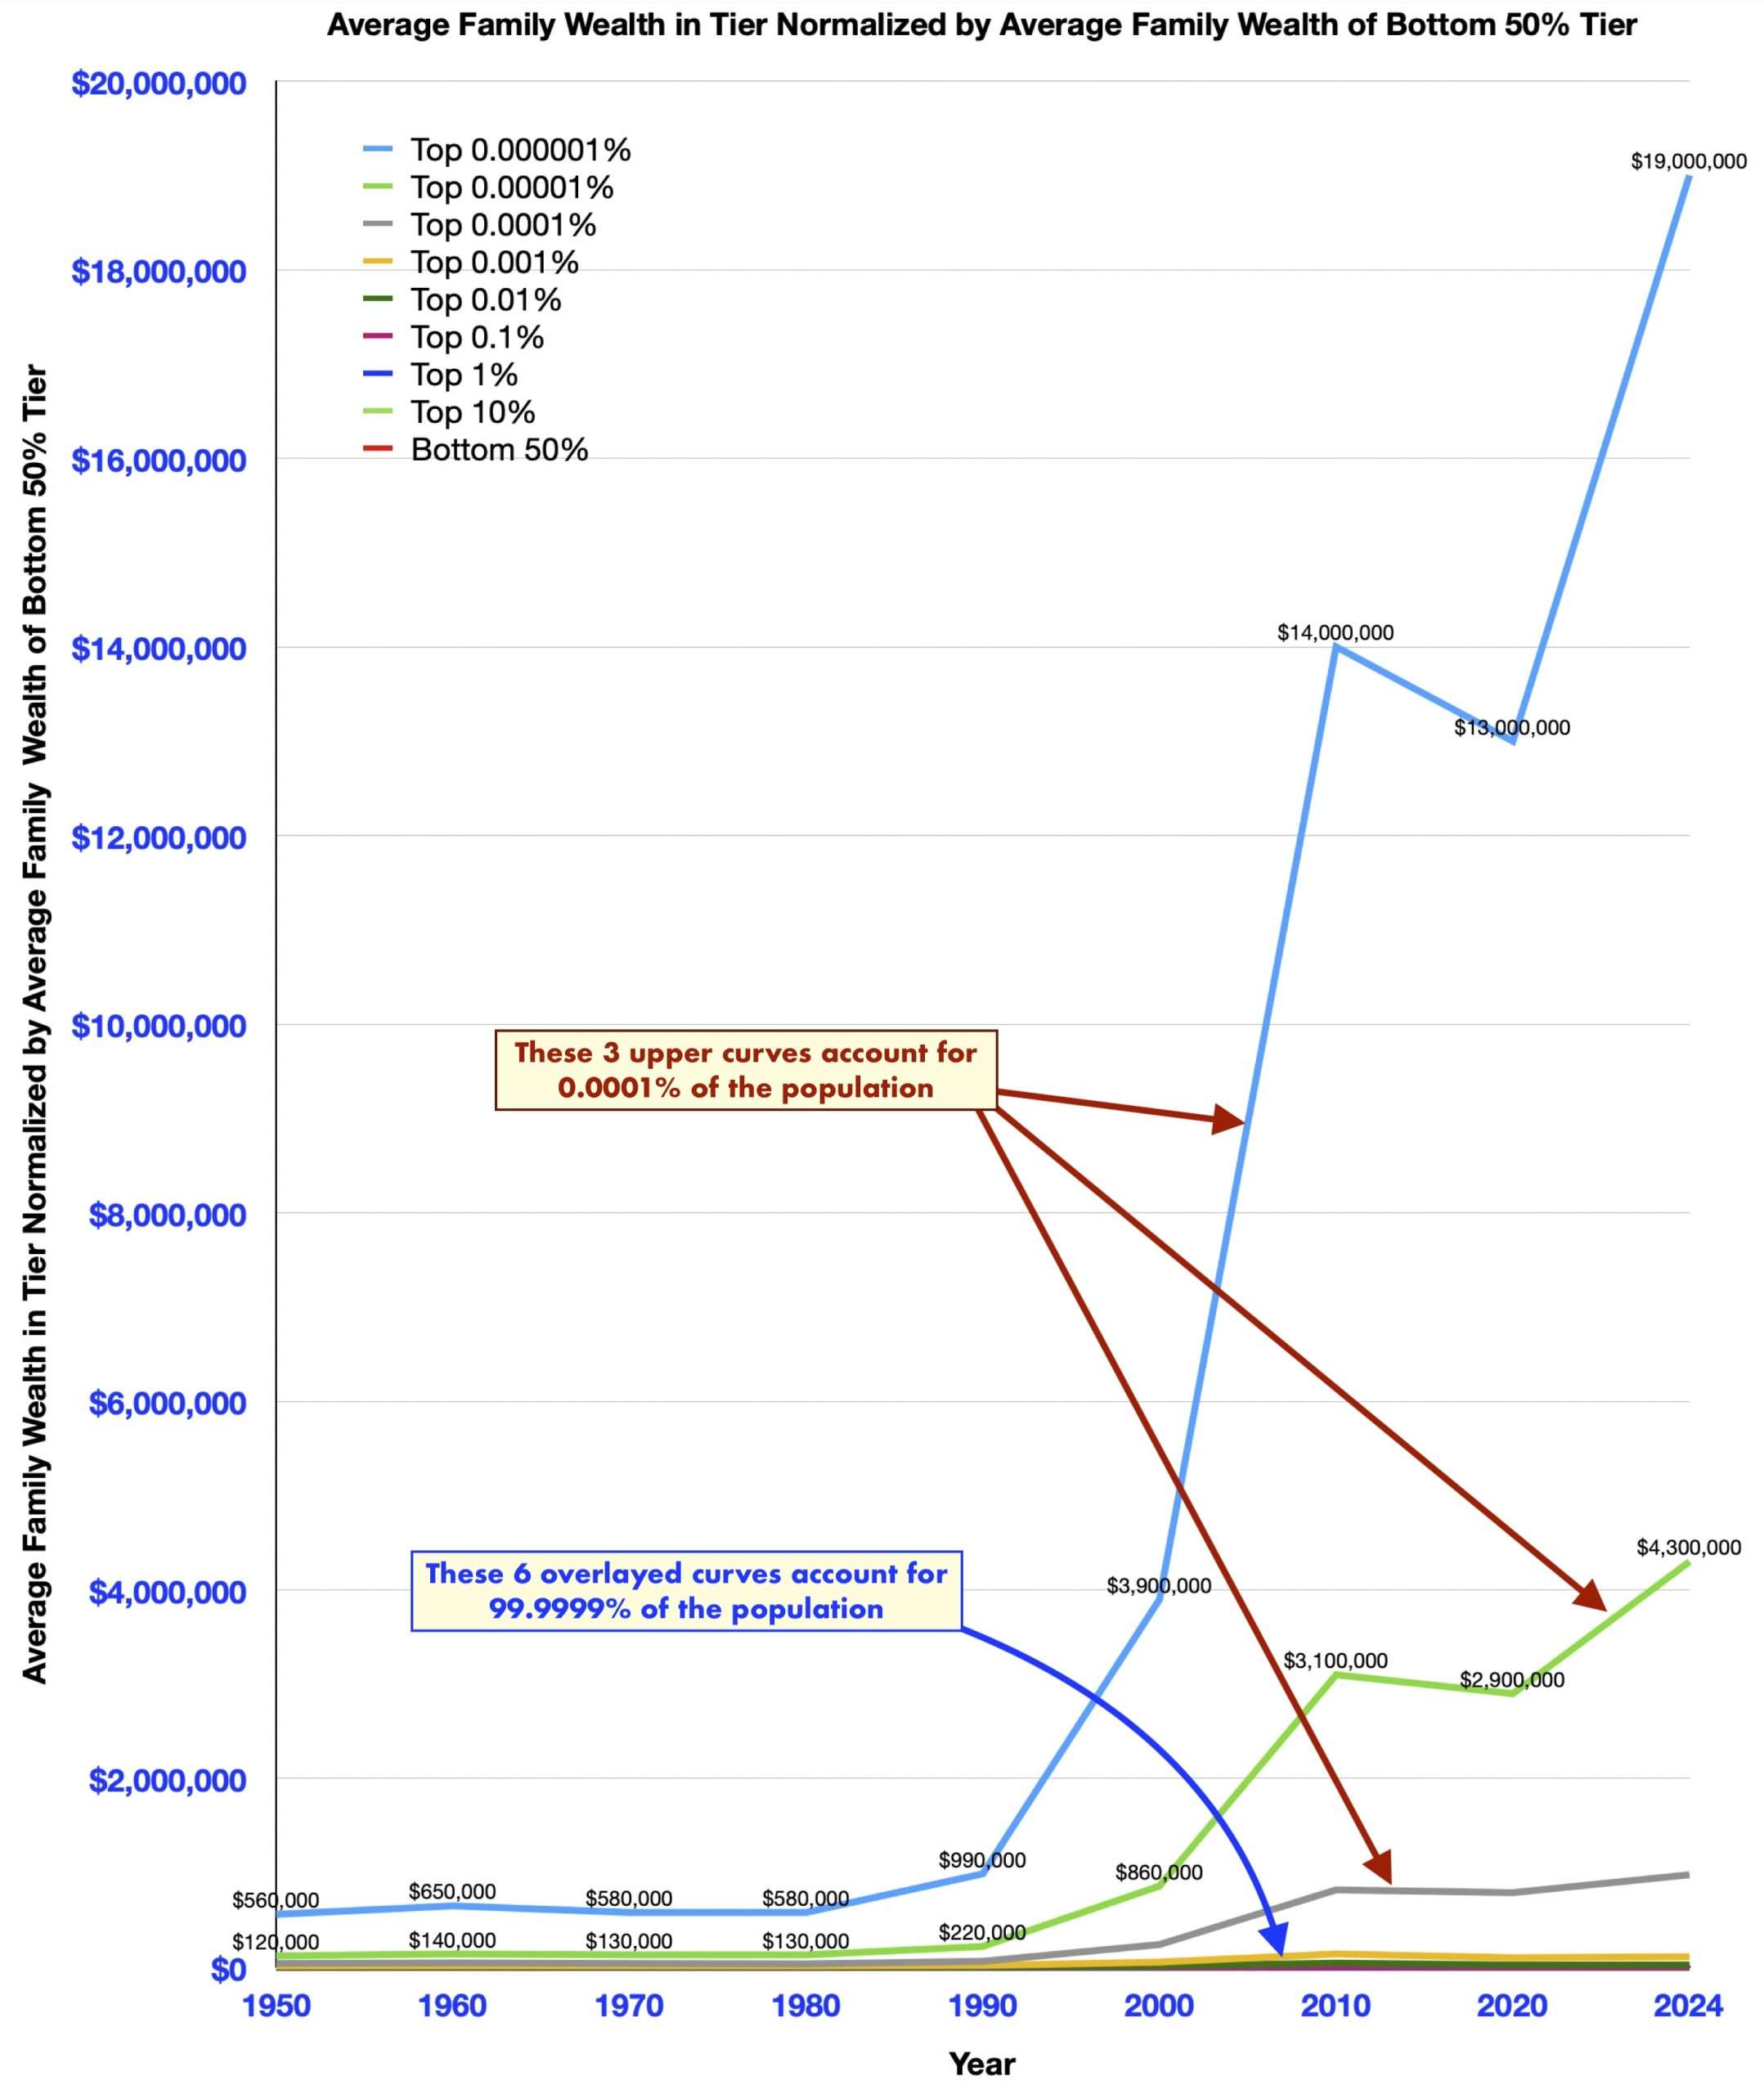
America’s Wealth Inequity Revealed in a Log-Linear Graph
To see the entire economic landscape on one graph, we must plot the Y-axis on a logarithmic scale, creating a log-linear graph, in which every major increment on the Y-axis represents a tenfold increase in relative wealth ($10, $100, $1,000, and so on).
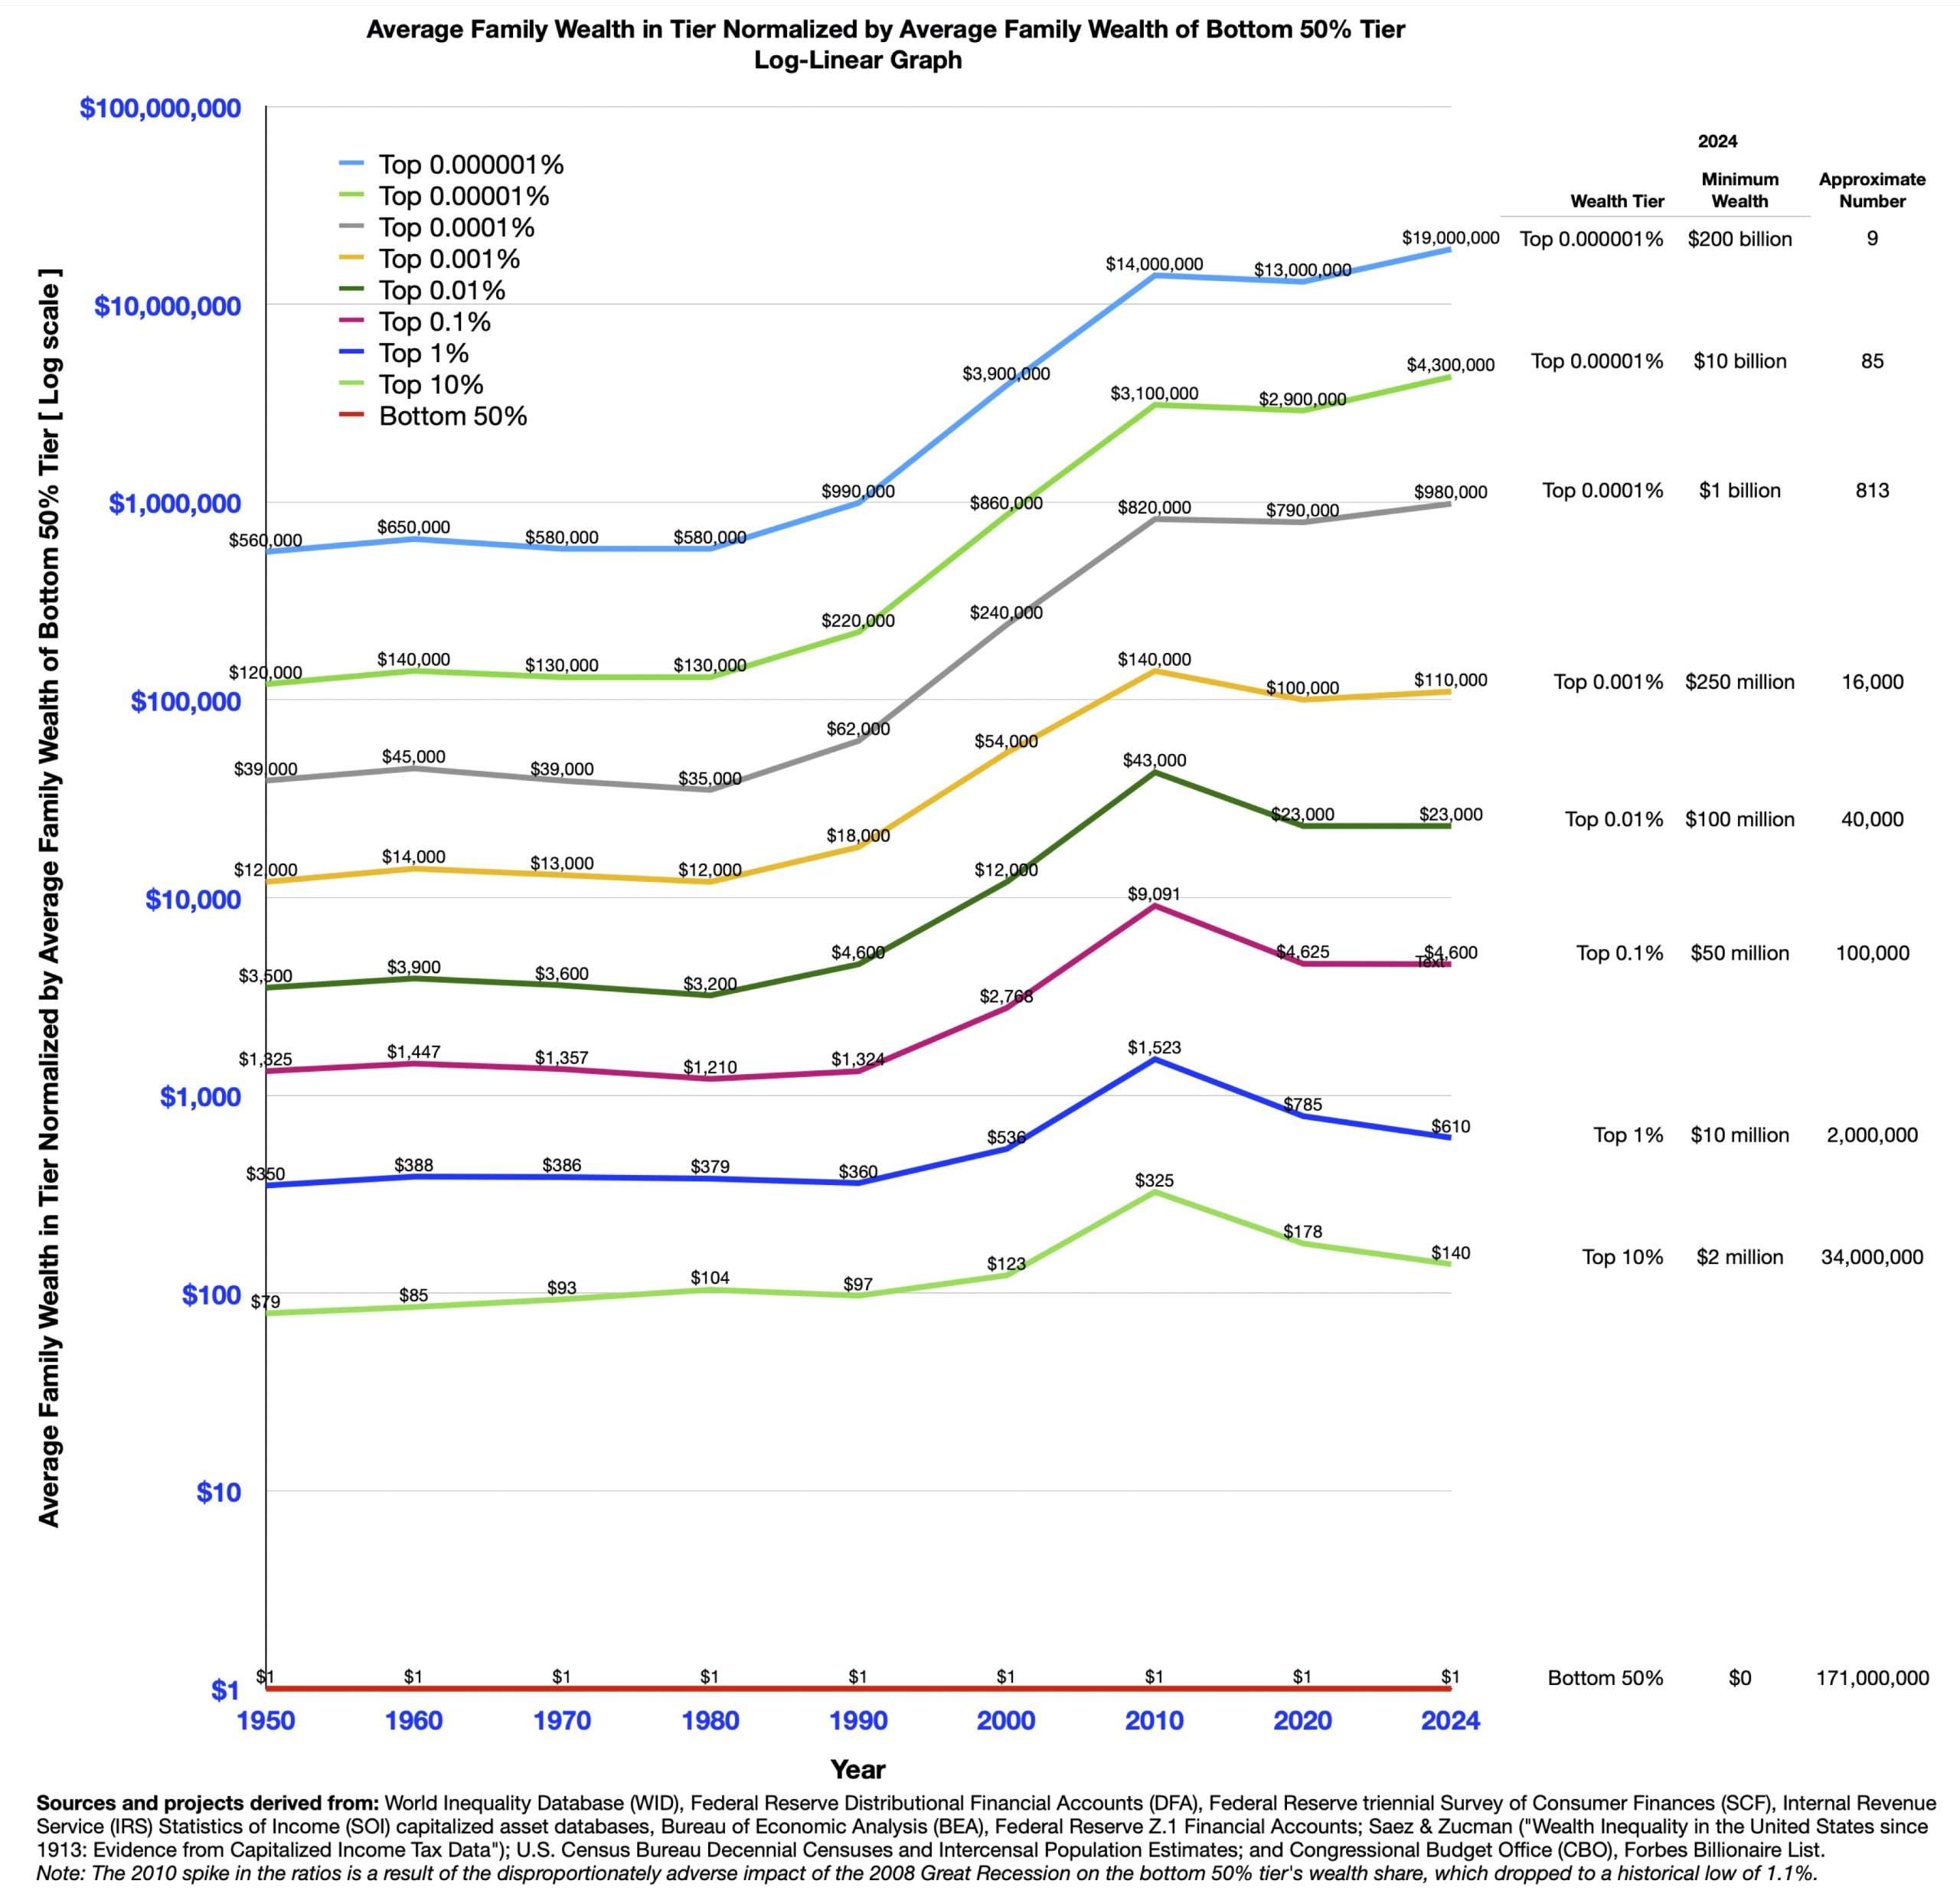
The log-linear graph reveals the true magnitude of America’s economic divide for all strata of wealth.
We can now see that $1 spent by a person in the Bottom 50% is, in proportion to their total wealth, the equivalent of a person in the higher income brackets spending . . .

The Reality of Relative Value
To translate these astronomical ratios into everyday economic reality, we can look at the relative impact of common financial transactions:
• Purchasing a Car: When a person in the Top 0.0001% purchases a Rolls-Royce for $500,000, the equivalent financial impact for a person in the bottom 50% is just 51 cents.
• Charitable Donations: When an ultra-wealthy individual makes a much-lauded charitable donation of $100 million, for which they receive significant tax deductions, the mathematically equivalent sacrifice for an average person in the bottom 50% is approximately $23. When viewed from this perspective, the apparent generosity of the billionaire is revealed to be chimerical.
When a secretary pays a higher effective tax rate than their billionaire employer, Warren Buffett, and that secretary’s political influence is smaller by the same orders of magnitude as the difference in their wealth, the promise of a democracy that works for all Americans has clearly been abandoned.
The Feedback Loop
The danger of extreme wealth concentration is not merely economic but also political, amounting to the effective disenfranchisement of 99.9999% of Americans.
Extreme wealth buys outsized influence over elected officials and the judicial system, enabling the wealthiest households to shape the tools of government to redirect wealth upward. This self-reinforcing cycle drains both wealth and political power from America’s working class, and has led most Americans to believe that their government no longer works for them. As the graphs demonstrate, the gap between America’s richest and everyone else has been increasing for decades, and without an intervention, there is no rational reason to believe this is a self-correcting problem.
As billionaire Dario Amodei wrote in January 2026:
Something is dreadfully wrong with America.
Hayward Zwerling
17 July 2026